

3.1 Climate services and climate information sources
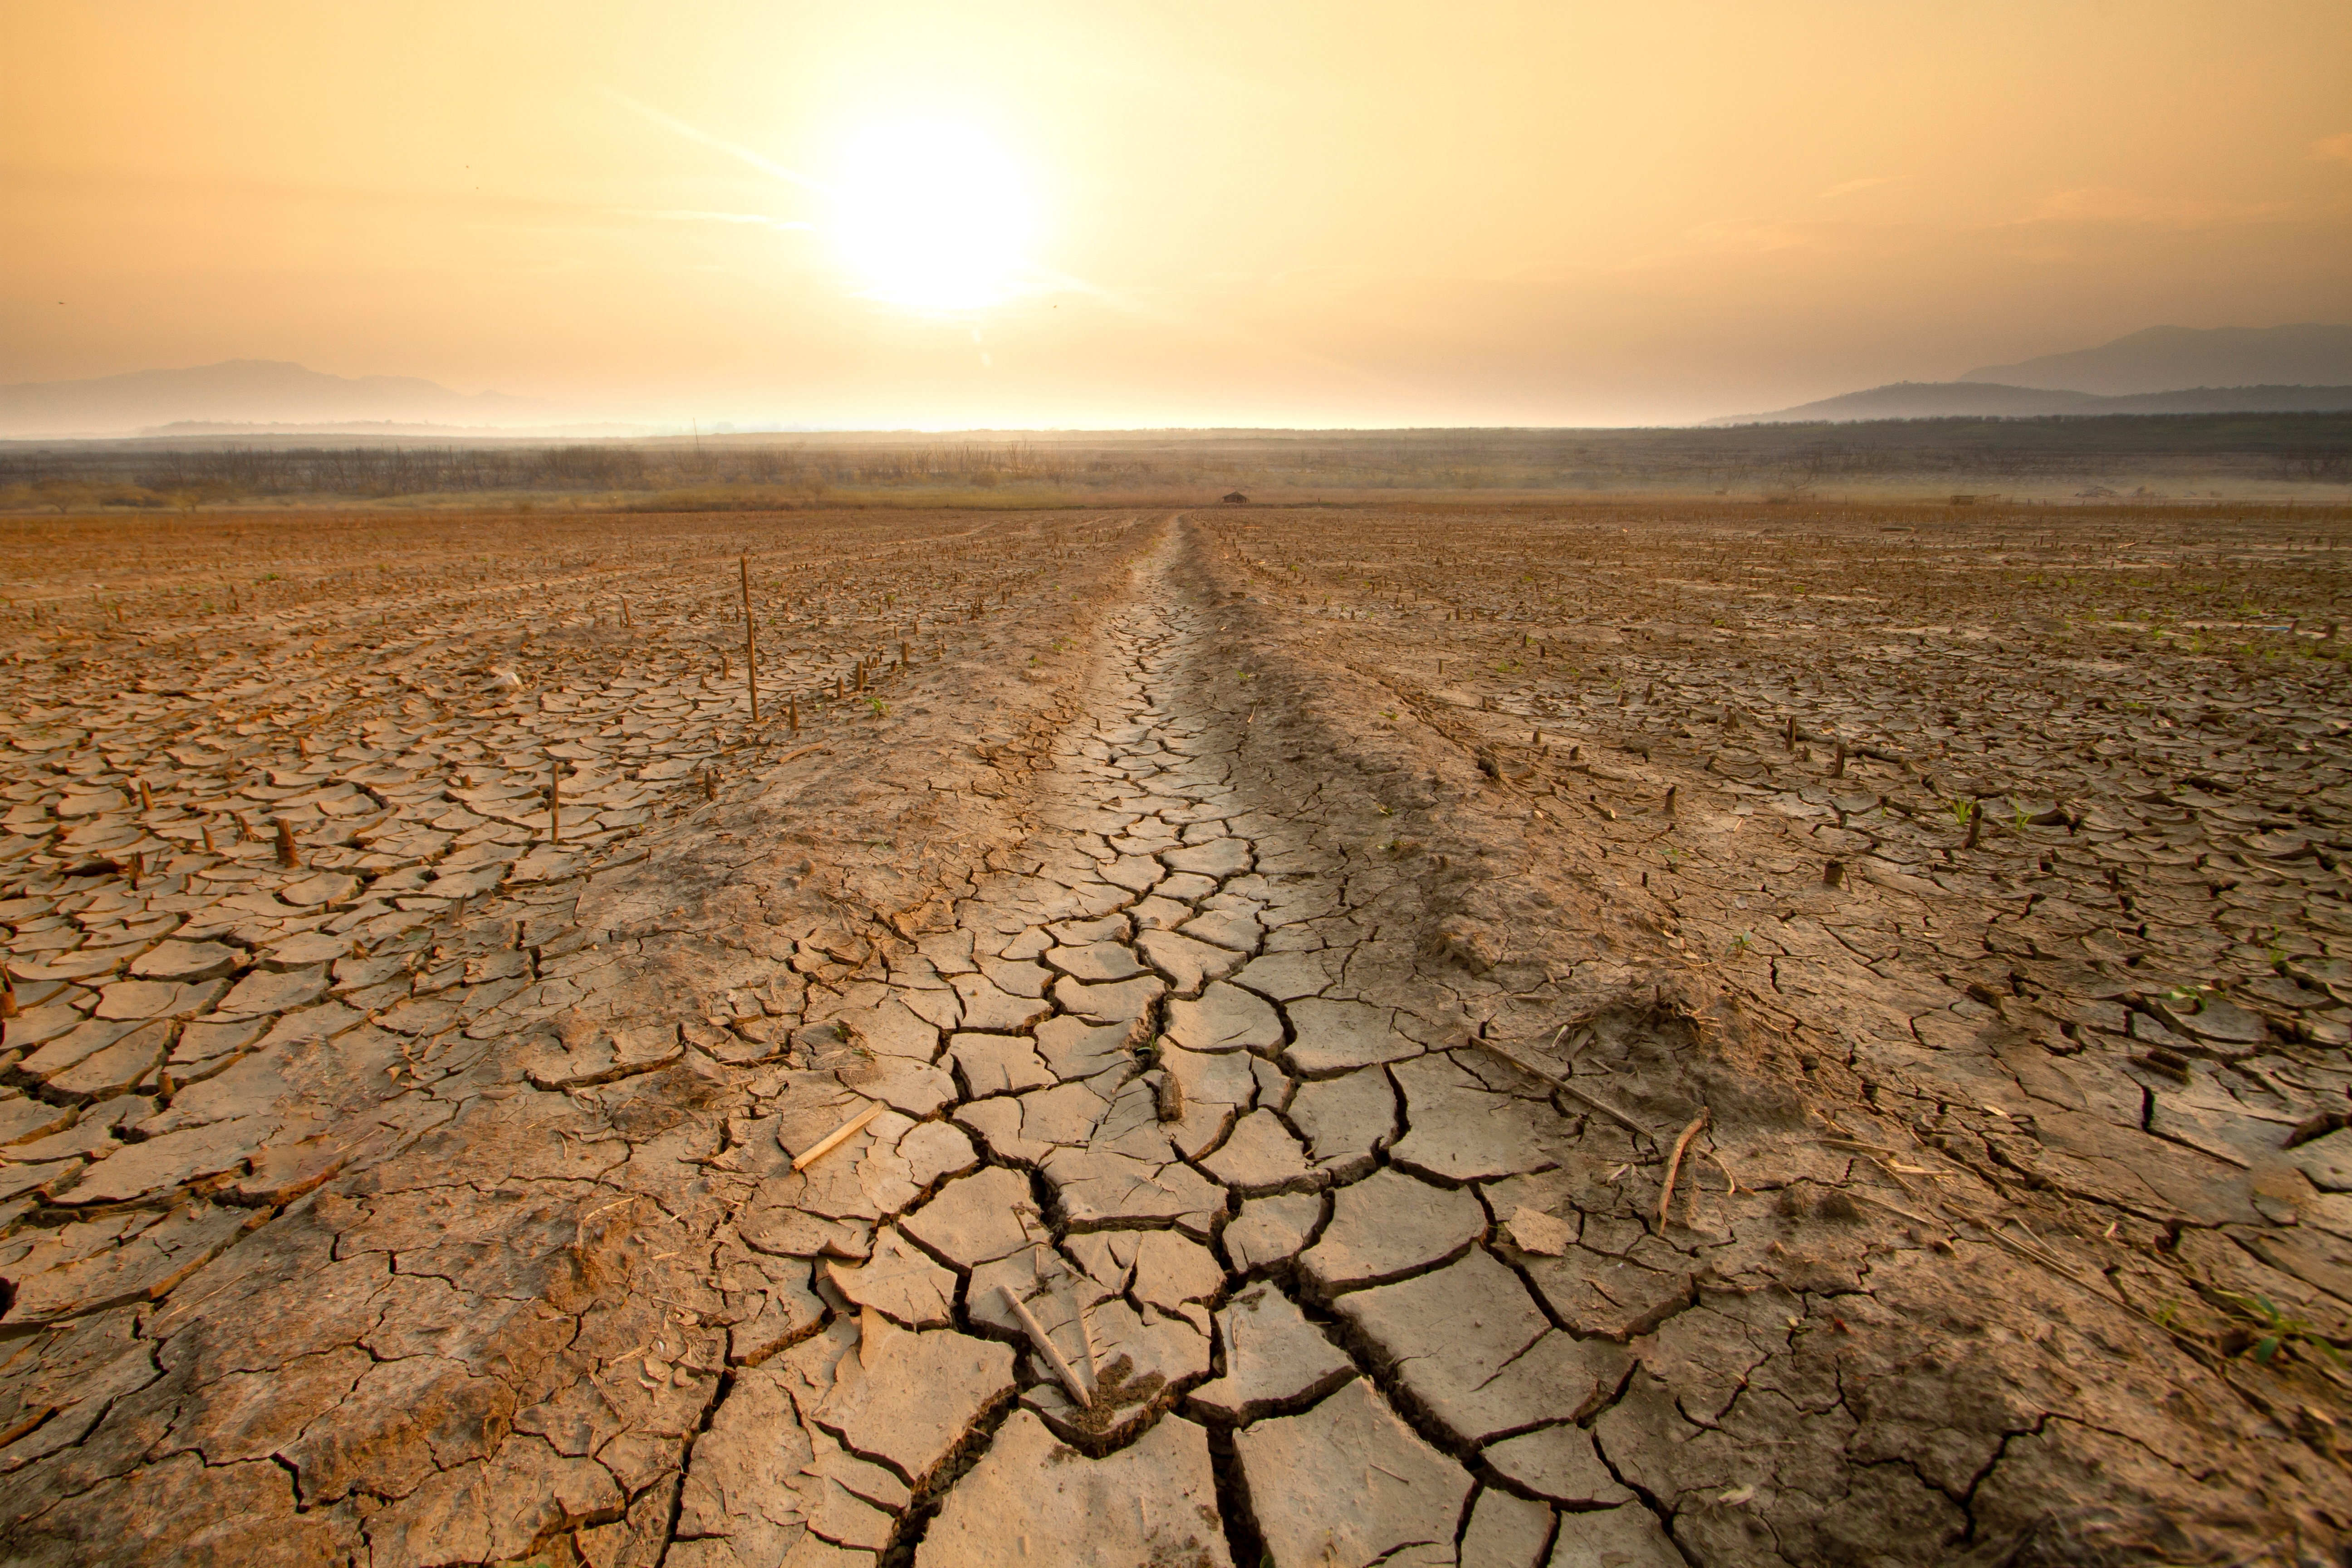
As Europe faces growing exposure to climate-related hazards, understanding the current and future impacts of climate change on various sectors—such as energy, transportation, public health, agriculture, and tourism—becomes essential. In this context, accessing reliable, science-based information on local climate conditions is crucial for empowering local authorities in planning for climate adaptation and resilience more effectively.
Click below to learn more about climate services and end-users.
Climate services
Climate services are defined as “the transformation of climate-related data – together with other relevant information – into customized user-friendly products or services such as projections, trends, economic analysis, risk assessments– counselling on best practices, development and evaluation of solutions – that may be of use to assist individuals, organizations or communities to make improved decision-making” (EC Research and Innovation Roadmap for Climate Services, 2015).
End users
The ‘end users’ represent a diverse range of stakeholders, including decision-making bodies, institutions, businesses, experts, and communities, all of whom can benefit from enhanced climate resilience by utilizing such services. For instance, public authorities can use early warning systems to make timely, life-saving decisions when extreme events happen. In other cases, climate projections or historical trends can aid farmers in selecting optimal crops and irrigation strategies, assist transportation sectors in optimizing routes and schedules (e.g., at airports), or support the tourism industry in planning for peak seasons.
Climate information can range from short-term and seasonal forecasts to long-term projections (i.e., sea level rise). In climate adaptation planning, different climate information can be combined with other sectoral information (such as population distribution, crop distribution, socio-economic determinants, etc.) to inform climate risk assessments. Climate services should always be grounded in scientifically credible information and expertise. But to be effective, climate data must be tailored to meet the needs of users, whether they are broad audiences or specific groups. Scientific climate information becomes a true climate service only when it enhances users’ understanding of climate-related impacts. In this context, the climate service co-design process is essential for identifying users’ needs and ensuring that services are developed to be both relevant and useful to the target audience.
The EU Adaptation Strategy highlights the role of latest digital technologies and climate services to underpin decision-making and supporting effective climate adaptation.
Global climate indicators
Why temperature isn't the full story
When people talk about climate change, they often focus on the global average surface temperature. It’s an important measure—but it’s not the only one. Climate includes long-term weather patterns in a specific area, and changes affect more than just temperature. Oceans, air, ice, and even the chemical makeup of our atmosphere all play a role.
The Essential Climate Variables
The Global Climate Observing System (GCOS), part of the WMO, has defined more than 50 ECVs that critically contribute to the characterization of Earth’s climate. The ECVs were identified based on relevance, feasibility and cost-effectiveness to support climate research, modelling and assessments. They are categorized in the following way:
- Atmosphere: variables related to surface, upper atmosphere and atmosphere composition, such as precipitation, surface pressures, surface temperature, clouds, aerosols, ozone etc.
- Land: variables related to hydrology, cryosphere, biology, as well as the human use of natural resources; they include, river discharge, glaciers, permafrost, anthropogenic greenhouse gas emissions, among others.
- Ocean: variables related to the physical, biogeochemical and biological conditions of the oceans; they include sea level, sea surface temperature, nutrients and marine habitats, among others.
Each of these ECVs is regularly monitored and assessed, and can be described and communicated in numerical terms.
What are Climate Impact Indicators (CIIs)
While ECVs track how the climate itself is changing, Climate Impact Indicators (CIIs) show how these changes are affecting our daily lives. These indicators measure the real-world effects of climate change on people and ecosystems, like:
- The number of extreme heat days
- Frequency of droughts or floods
- Shifts in rainfall patterns.
CIIs help us understand the consequences of climate change in specific regions or sectors, like health, agriculture, or urban planning.
What drives these changes?
To understand the “why” behind those impacts, we turn to Climate Impact-Drivers (CIDs). These are the physical climate factors—like heat, cold, drought, and storms—that cause changes in the environment. They’re the forces behind the effects we observe. For example:
More heatwaves = more wildfires or heat-related illnesses
More intense rainfall = flooding or landslides
The IPCC has identified 33 CIDs across 7 categories: heat, cold, wet, drought, wind/storm, snow/ice, and coastal. Knowing what drives change helps us build better strategies to adapt and respond.
CIIs vs CIDs - What's the difference?
Think of it in this way:
CIIs = What’s happening (e.g., more heatwaves, floods)
CIDs = Why it’s happening (e.g., rising temperatures, changing rainfall)
We need both to fully understand climate change. CIIs show the impact. CIDs explain the cause. Together, they help us plan, prepare, and protect our communities.
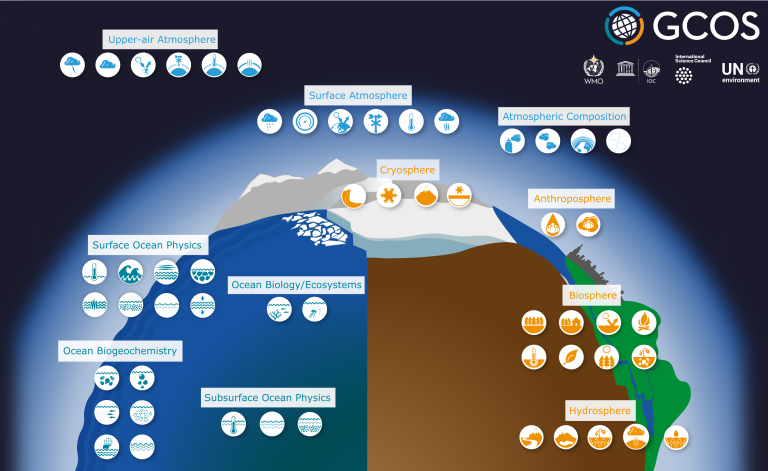
Figure 1: Essential Climate Variables:
https://gcos.wmo.int/site/global-climate-observing-system-gcos/essential-climate-variables/about-essential-climate-variables
Climate data sources:
Climate data can take different forms and be collected by different sources. The main distinction is between observations and climate models.
Hover over each flip card to learn more
Observations
Climate models
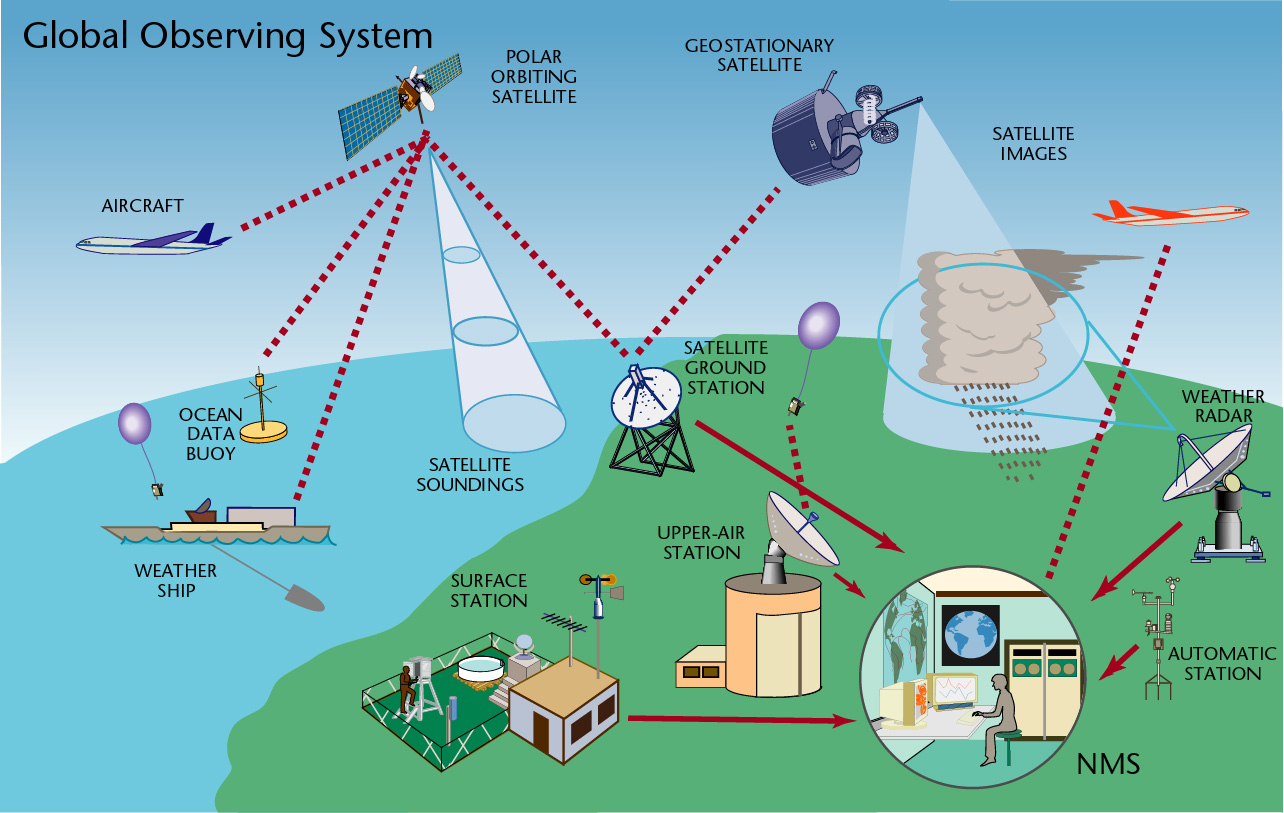
Figure 2: Global Observing Source:
https://community.wmo.int/en/observation-components-global-observing-system
Watch a video about re-analysis
developed by Copernicus Climate Change Service (C3S)
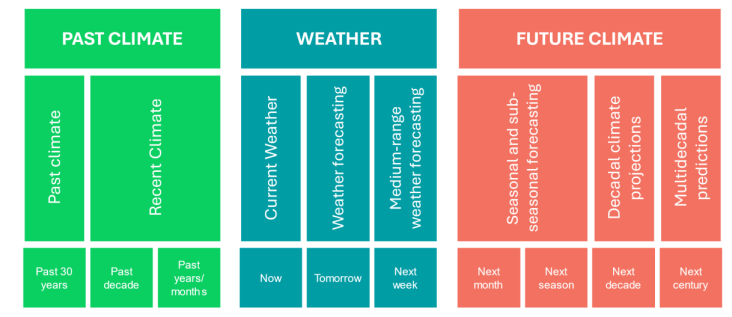
Observation (or re-analysis) are used for past to present time, while climate models cover weather forecast, seasonal forecast, annual to decadal predictions and long-term projections. The Copernicus Climate Change Service (C3S) has become the “One-Stop Shop” for acquiring seasonal forecasts, compiling forecasts from different sources.
Annual to decadal predictions, sub-decadal predictions or near-term climate predictions fill the gap between shorter-term seasonal forecasts and long-term climate projections. They used climate models (like for long-term projections) but every year the models are restarted with real-time observations of both oceans and atmosphere. WMOLC-ADCP collects and provides hindcasts, forecasts and verification data from several contributing centres worldwide. It provides graphical products for free, but access to raw data needs authorization of the national meteorological service.
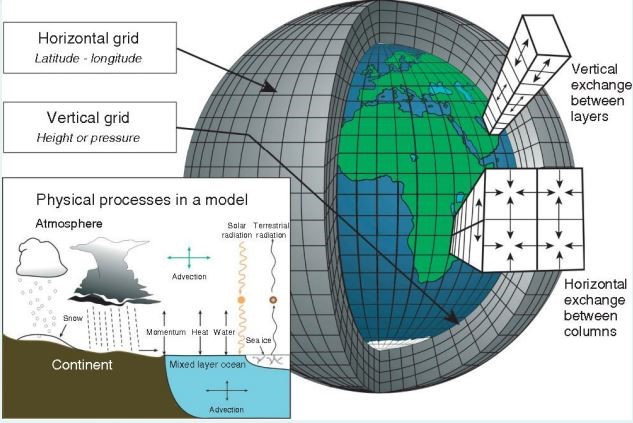
Figure 3: Source: Charron, I. (2016). A Guidebook on Climate Scenarios: Using Climate Information to Guide
Long-term projections are covered by global climate models (GCMs) and regional climate models RCM. GCMs usually used calculation grids models that cover the entire planet with a typical horizontal resolution of around 200 km. They have evolved a lot and most recent GCM models (known as Earth system models) include not only atmospheric circulation models, atmospheric-oceanic general circulation models, but also biogeochemical interactions. Regional Climate Models (RCMs) have smaller domains and only covers a portion of the planet. By focusing on a limited area of the globe, they can achieve a finer horizonal resolution (45 km or less).
Copernicus Climate Change Service (C3S)
Copernicus is the EU’s Earth Observation Program. It collects data from multiple sources through a complex set of systems and provides users with a set of services that offer climate-related information. C3S provides authoritative information about the past, present and future climate, as well as tools to enable climate change mitigation and adaptation strategies by policy makers and businesses. It provides climate data and information on impacts on a range of topics and sectorial areas through a Climate Data Store (CDS), designed to enable users to tailor services to more specific needs (public or commercial). Copernicus provides the following main products and services:
Products and services
Climate Data Store: it provides easy access to a wide range of climate dataset through a searchable catalogue. It also includes an API to access the full datastore catalogue and an online earthkit – open-source python library and tools for simplifying data access, processing, analysis, visualisation for users to build workflow suited to their needs
Applications
Climate Pulse: It is a very intuitive and interactive application to make climate monitoring more accessible to a broad audience. It provides daily charts and maps of global surface air temperature and sea surface temperature updated close to real-time, as well as an archive of past daily, monthly and annual maps, based on based on data from the ERA5 climate reanalysis. You can select the years (from 1956 up to today – 19 February 2025)
Global temperature trend monitor: This application informs about how close we are about to reaching a global warming of 1.5˚C. It shows exactly where we are right now and how soon we would reach the limit if the warming continued at today’s pace
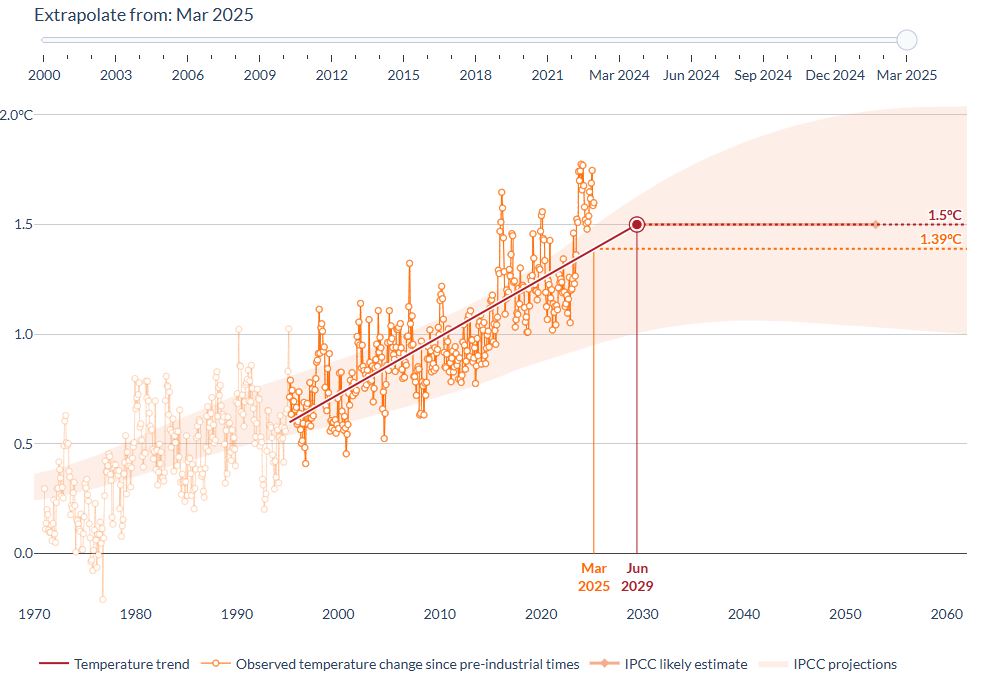
Figure 4: C3S global temperature monitor. Source:
https://apps.climate.copernicus.eu/global-temperature-trend-monitor/?tab=plot
Summary
Reflection
- What is the difference between climate information and climate services?
- How observations and climate models are used and which timescale do they cover?
- What are the main services and tools about climate provided by Copernicus?

