

Application of climate services in cities
Cities across Europe are increasingly integrating climate services into their planning and
infrastructure projects to enhance climate adaptation and resilience against flooding,
heatwaves, sea-level rise and other hazardous impacts. The use of high-resolution climate information support cities and local authorities in informing strategies, programs and projects. Information about include temperature trends, precipitation patterns, land use changes, sealevel rise projections can be used in several applications, such as heat risk mapping, flood modelling, stormwater management and air quality monitoring. As already presented in the previous section, Copernicus Climate Data Stores offers accessible applications that can be used both by scientist and practitioners. For example, the Climate Pulse provides daily charts and maps of global surface air temperature and sea surface temperature updated close to real-time, as well as an archive of past daily, monthly and annual maps, based on data from the ERA5 climate reanalysis.
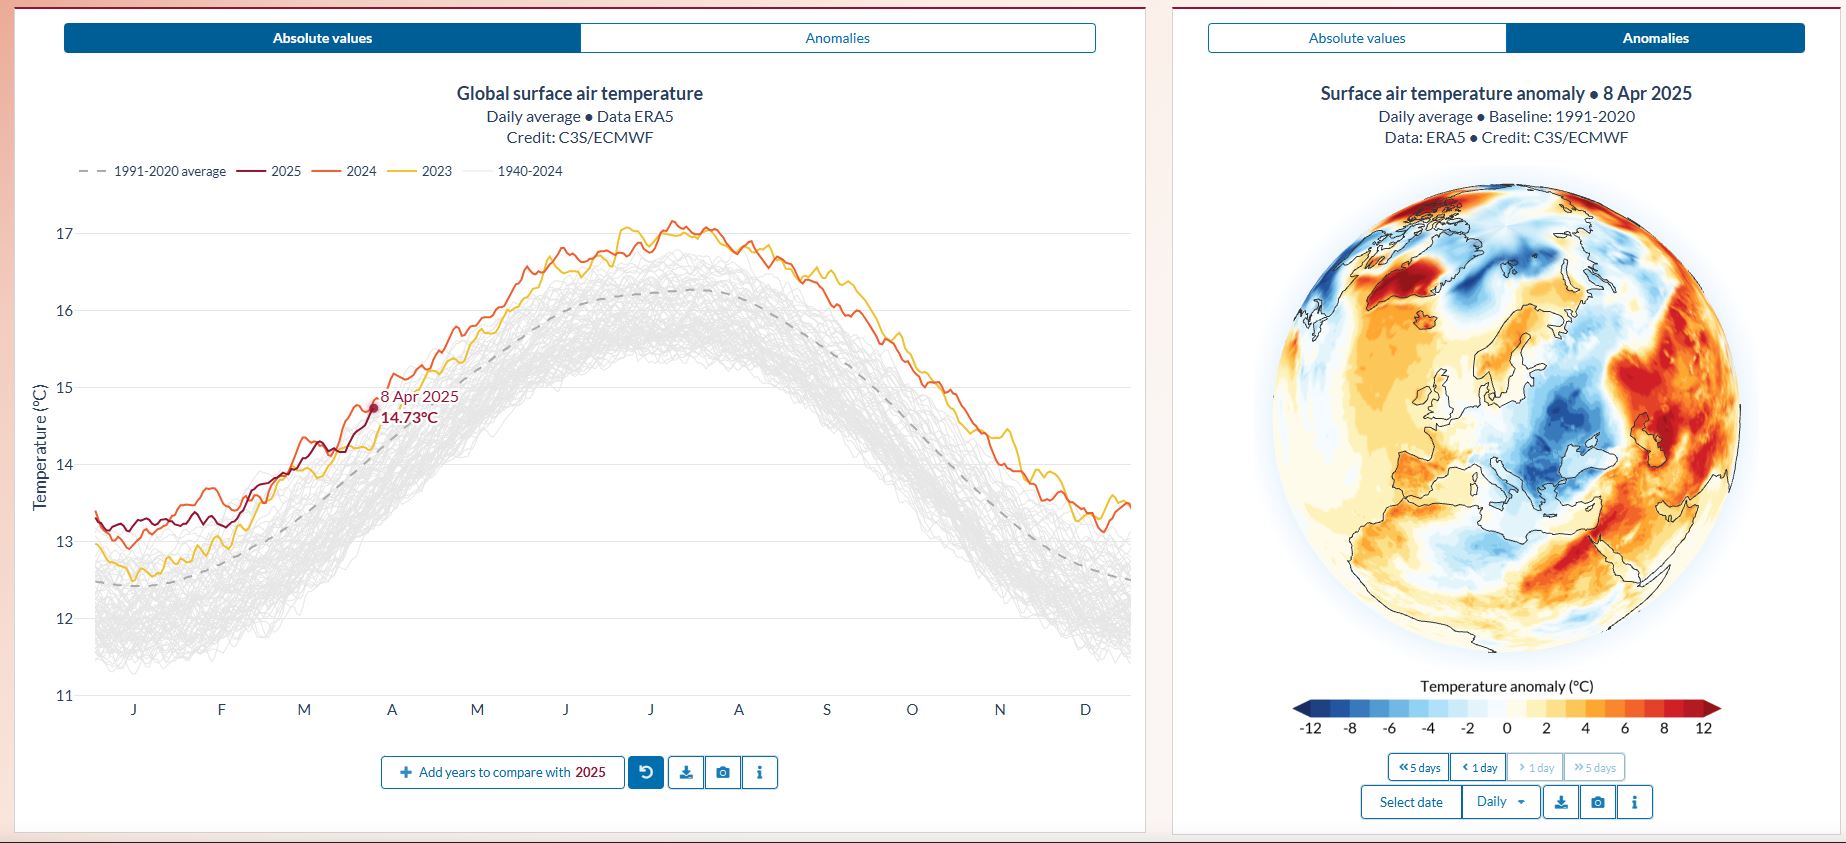
Figure 1: Copernicus Ciamte Pulse:
https://pulse.climate.copernicus.eu/
The Copernicus Interactive Climate Atlas allows for flexible exploration and analysis of past and future climate monitoring and change information from multiple lines of evidence provided by the observational, reanalysis and climate change projection datasets available in the C3S Climate Data Store (CDS). The Atlas facilitates global and regional in-depth assessment of past trends and future changes in key variables and (extreme) indices for different periods across emission scenarios or for different policy-relevant global warming levels. Different graphical climate products such as maps and timeseries (or stripes) can be interactively customized to display temporally- or spatially-aggregated values (or changes relative to different baselines) over flexible seasons, periods and regions.
The C3S global temperature trend monitor shows exactly how the global temperature is reaching the global warming of 1.5˚C and how soon the limit would be reached at today’s pace.
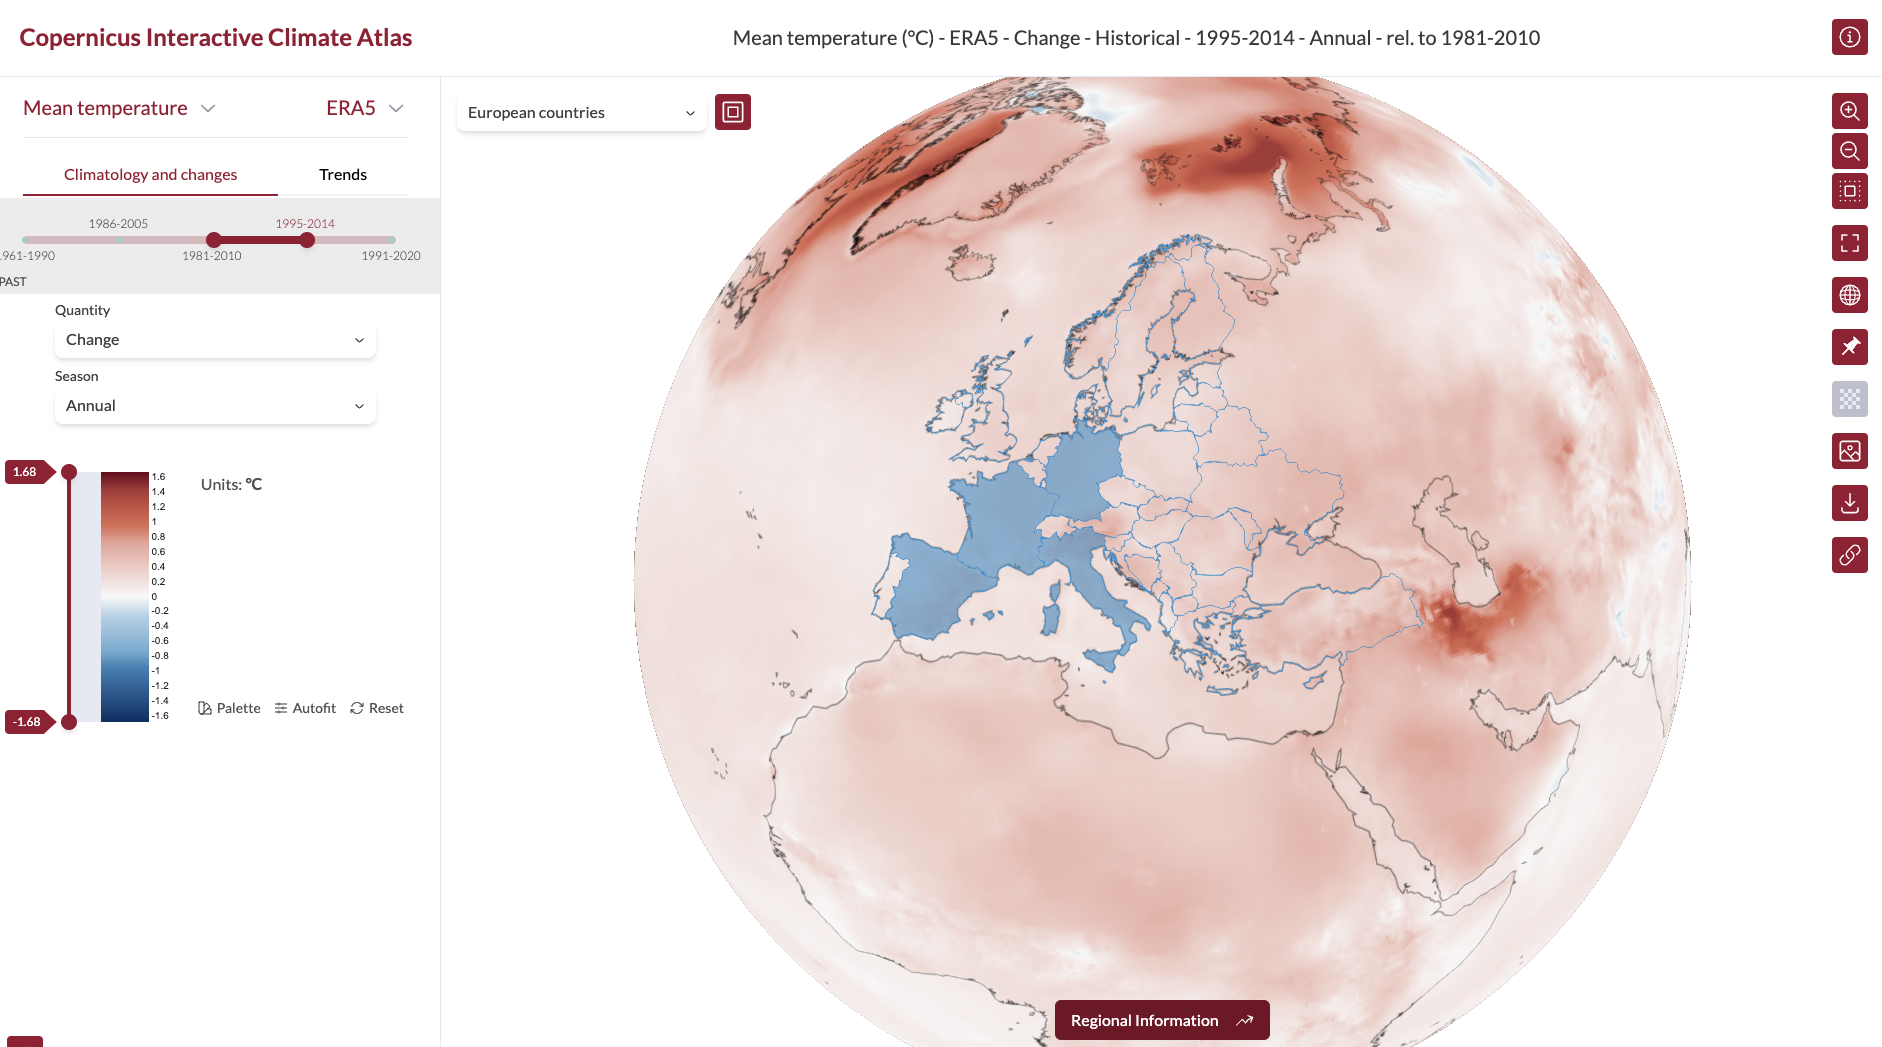
Figure 2: Copernicus Interactive Climate Atlas. Source: https://climate.copernicus.eu/copernicus-interactive-climate-atlas-guide-powerful-new-c3s-tool
Climate services tools within REACHOUT
Within REACHOUT project, seven European municipalities (city-hubs) co-developed a series of tools and services supported by technical partners. Some tools were fully co-created during the project, existing tools were further improved as part of the co-development process to comply with local needs, while already established tools were contextualized and adapted to the local setting. The tools implemented by REACHOUT project are included in the Triple-A Toolkit.
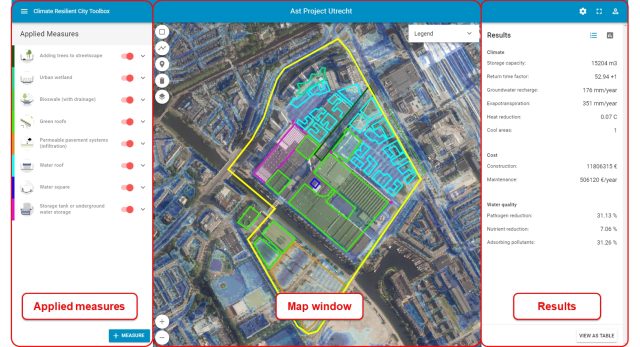
Climate Resilient City Tool
The Climate Resilient City Tool (CRCTool) aims to support collaborative climate adaptation planning and to promote multidisciplinary dialogue on adaptation options to increase urban climate resilience. The tool contains a database of over 50 adaptation measures including descriptions, pictures of best practices and references for further reading. The users can locate the measures on a map and explore and compare adaptation options for a project area. It provides information on the effectiveness of measures to reduce stormwater flooding, urban heat stress and drought. Additional information on construction and maintenance costs is also available. The CRCTool also encourages the use of Nature Based Solutions in comparison with traditional grey measures. In this way, it supports local authorities in the development of climate adaptation plans, strategies and master plans. In Gdynia the CRCTool is being customized to support multiple potential climate adaptation projects in the city. In Lillestrøm the CRCTool has being set up for specific redevelopment locations to support the dialogue between the city and project developers on how to contribute to the climate resilience of the city. In Athens the CRCTool will be configured to support the planning of Urban NBS for climate resilience for a large redevelopment project.
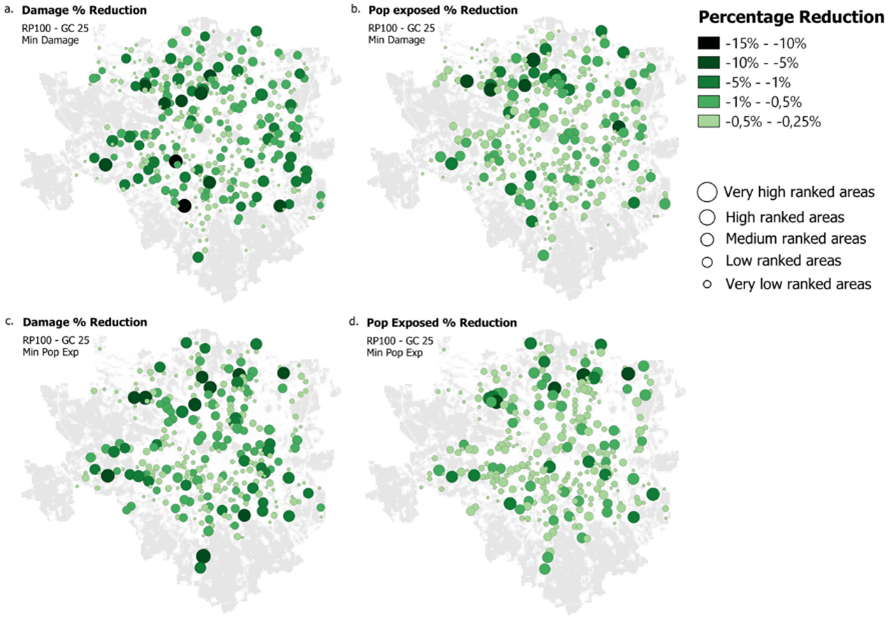
FloodAdapt Tool
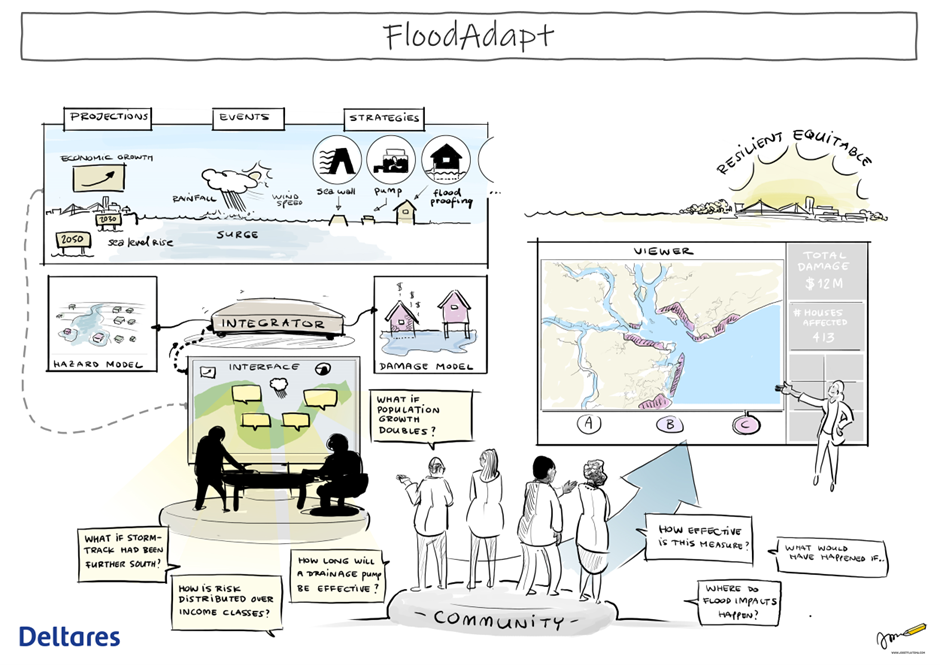
The FloodAdapt tool is a decision support tool intended to accelerate climate adaptation actions by making it easier for local and regional agencies to understand their flood risk under different future conditions. FloodAdapt can be used to assess compound flooding, that means any combination of marine, rainfall and riverine flooding, with or without the added effects of future sea level rise, changes in rainfall patterns and storminess and socioeconomic developments. The user interface of the FloodAdapt tool makes powerful and efficient flood hazard and impact models easily accessible to users without a computational modeling background. It helps users to define, simulate and visualize flooding scenarios and their impacts and to explore effective strategies to reduce flood risk. Scenarios consist of user-defined or historical weather events, projections of future sea level, climate and socio-economic developments, and user-defined adaptation strategies such as floodwalls, levees, pumps, urban green infrastructure, raising, floodproofing and buying out homes. In Cork, the FloodAdapt tool has been set up to support the city council in their long-term flood risk management planning. This decision support system makes it easier to understand flood risk under different scenarios and test various adaptation options. The results can be used to inform adaptation pathways development.
Pluvial Hazard, Risk assessment and Adaptation Tool
This tool is designed to help local authorities to explore pluvial hazard & risk from extreme convective precipitation events and subsequent flooding due to surface rainwater accumulation which the existing urban drainage system is unable to absorb. The tool delineates the areas prone to flooding under different rainfall intensities and persistence and estimates the damage to physical assets such as buildings’ structures and content. The tool is amendable to inform adaptation measures such as green urban regeneration and natural water retention measures by means of green roofs and green urban areas. The tool is meant for urban planners, local citizen action groups, civil society organizations, businesses and risk managers (insurers and insurance brokers). City hub Milan has implemented the full application of the tool along with the extension to analyse the green infrastructure network. Other cities such as Athens, Gdynia and Logrono are preparing for the application of the tool.
Social Vulnerability Index
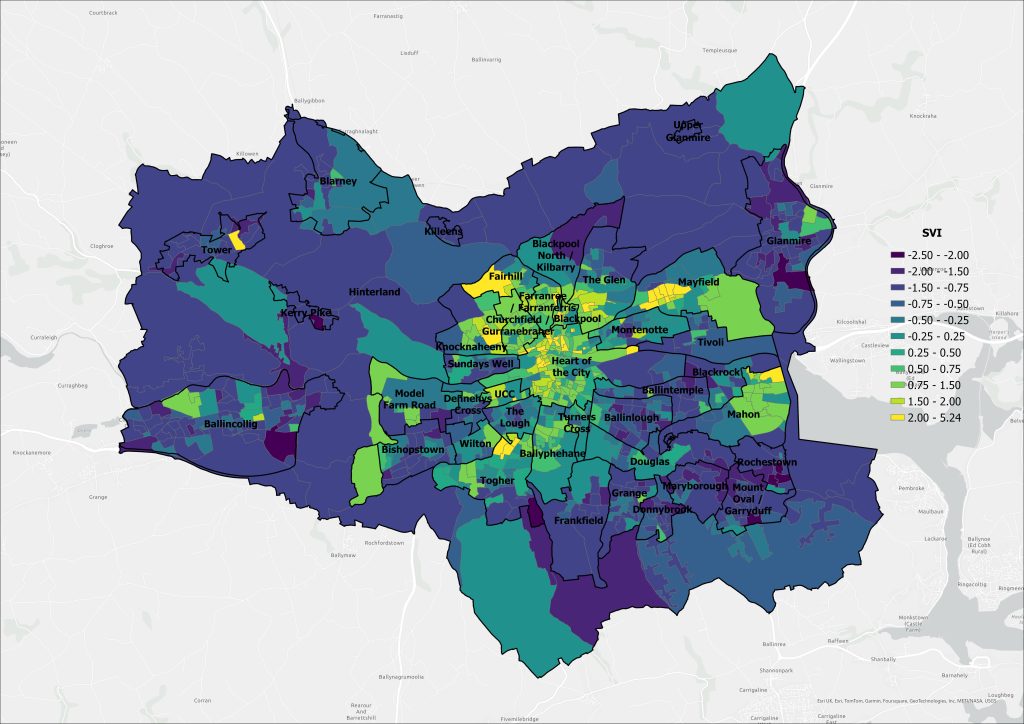
The tool compiles census data for various indicators (such as housing quality, unemployment rate, and average education levels) to analyze the vulnerability of a given community to climate change. The tool also provides an index or score of socio-economic vulnerability for each census-defined small area within a region of interest. These data can be used in tandem with assessments of bio-physical impacts from climate change, or can be used as a standalone resource to inform decision-making. The tool allow users to better understand climate change risks for a given community, and to compare risks across regions using an easy-to-use map interface. The tool is intended to support decision-makers in municipal government and in industry sectors such as transport, water and agriculture, to assist both climate change adaptation and the transition to a carbon neutral economy. Cork is using the SVI Tool in combination with other REACHOUT tools, and as part of its statutory obligations to develop and implement a Local Authority Climate Action Plan in 2023. Athens is using the SVI tool to identify areas of high vulnerable population density and combine to the output of its heat-related work. Logroño is using the tool to better define and understand the SVI with regard to the heat and flood hazard and be able to identify areas of high social vulnerability; additionally, Gdynia will use the SVI Tool in conjunction with the Climate Resilient Cities Tool in order to support spatial adaptation decisions for the city.
Thermal Assessment Tool
Climate change is leading to an increase in the frequency and intensity of extreme heat events. The Thermal Assessment Tool (TAT) is designed to provide a user-friendly visualization of past, present and future extreme heat episodes (heatwaves) in European regions and cities to raise awareness and better support heat risk assessment. The tool visualizes heat-related data and offers added-value information regarding the impact of heatwave events at both regional and local scale. This information is crucial to improve knowledge and, thus, the adaptative capacity of regions and cities and supports different stakeholders in the design of adaptation plans and regional policies. The tool offers two services:

Hover over each flip card to learn more
Heatwave service
Heatmap service
Summary
Reflection
1. How can the use of high-resolution climate information support cities and local authorities in informing climate strategies, programs and projects?
2. How can you find information about global temperature in Copernicus?
3. How can you combine different tools (i.e., Thermal assessment tool and Social Vulnerability tool) to identify local hotspots and priority areas?

